Address
Pittsburgh, PA
Work Hours
Monday to Thursday: 9AM - 5PM ET
Friday: 9AM -1PM
Address
Pittsburgh, PA
Work Hours
Monday to Thursday: 9AM - 5PM ET
Friday: 9AM -1PM
Days
Budget
Features
Monthly maintenance
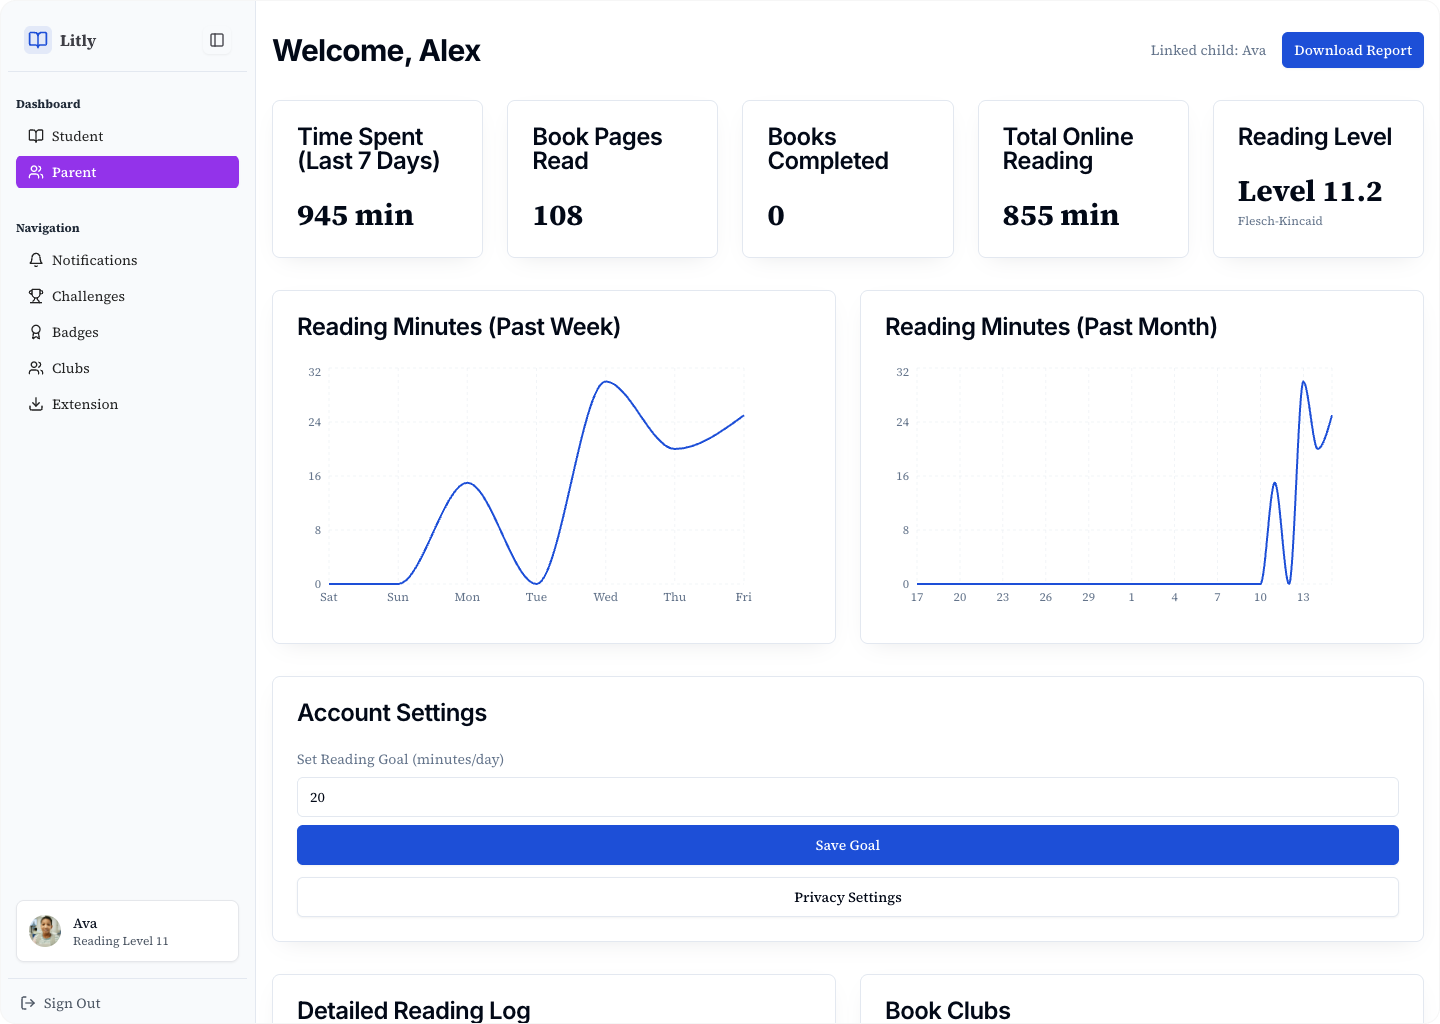
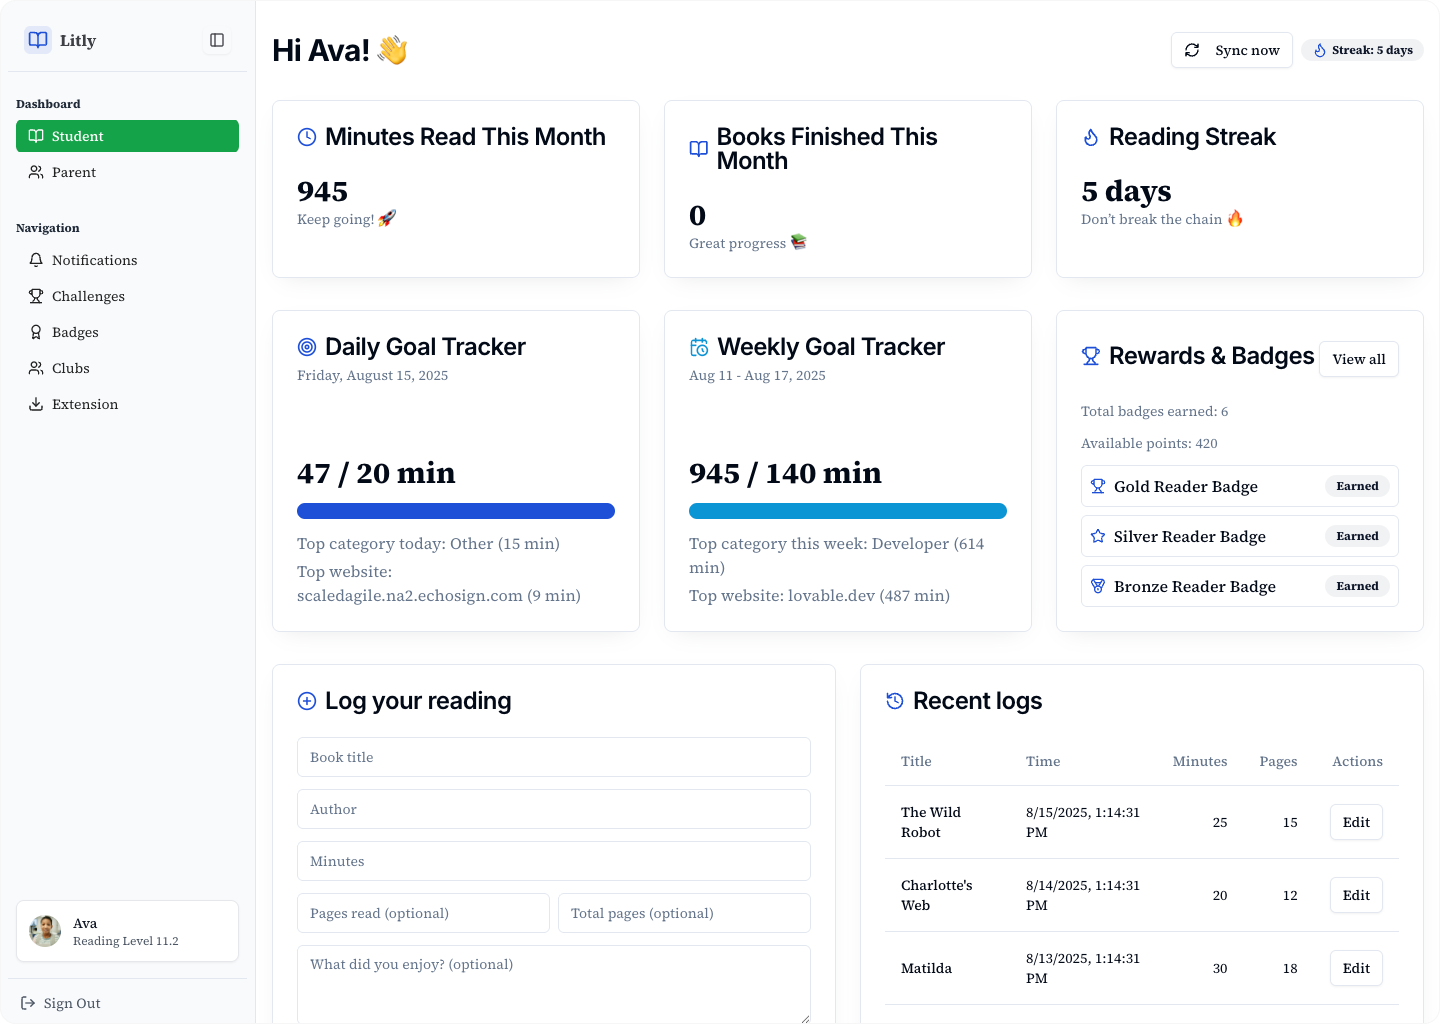
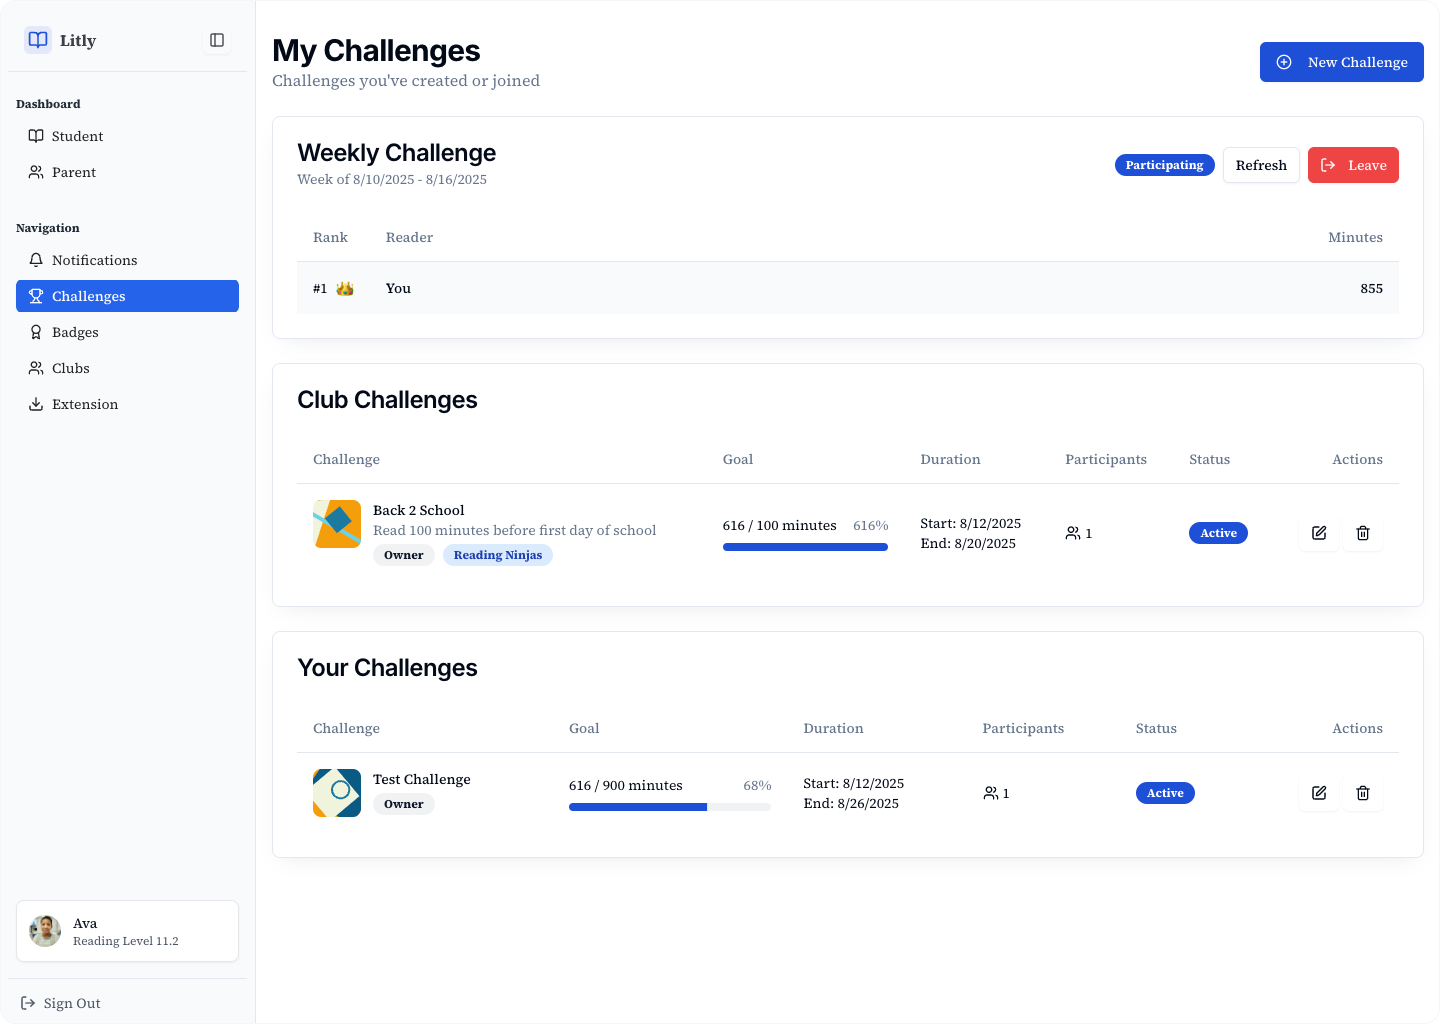
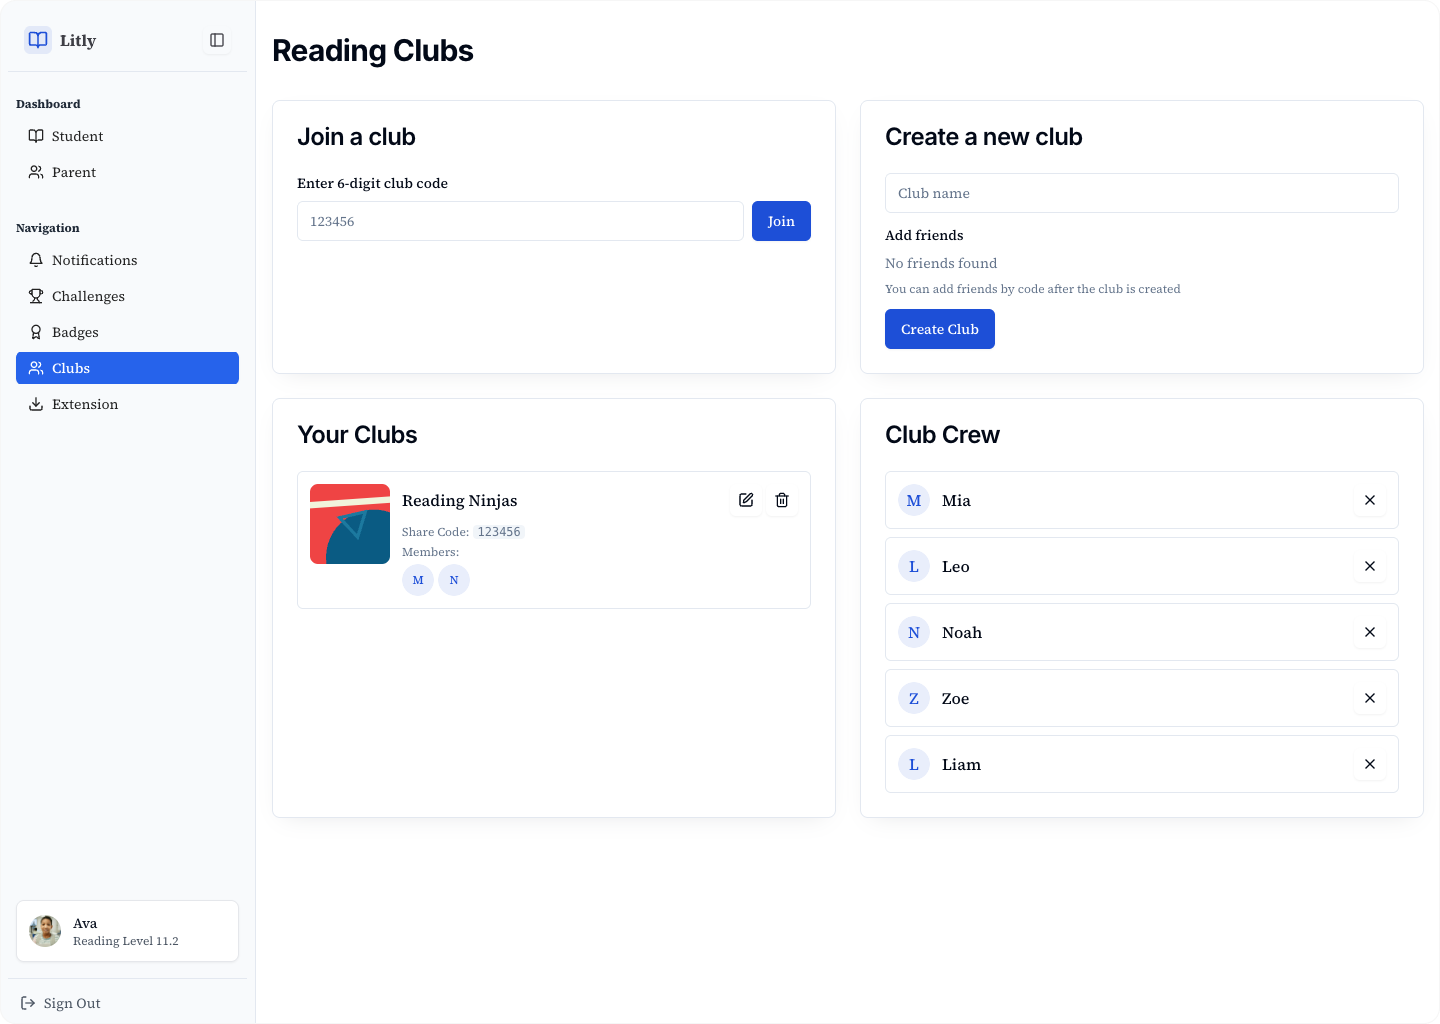
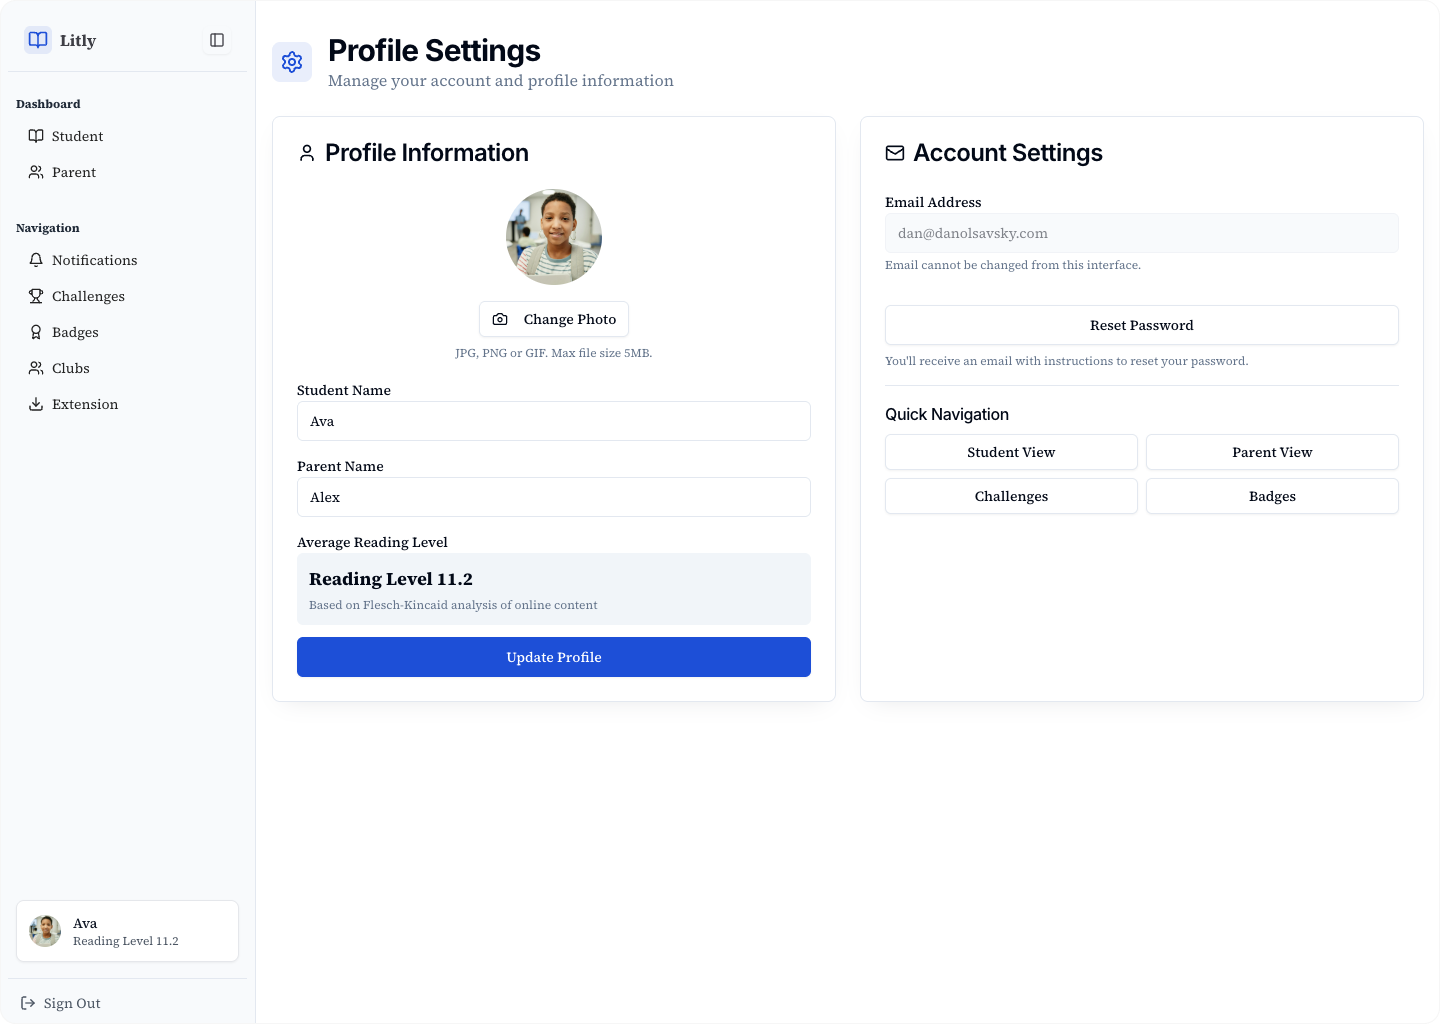
Schools and parents need reliable ways to measure and encourage reading, but most tools are clunky, expensive, or lack features that reflect how kids actually read today — especially online.
Teachers struggle to track progress, parents want visibility, and students need motivation.
We designed and launched Litly, a student-focused reading tracker built in just 5 days.
Key features included:
We run a focused 5-day cycle — discover, prototype, test, build, and launch — powered by AI and grounded in user feedback.
Day 1 – Discovery
We interviewed the client and staff using Google Meet (notes captured by Gemini), synthesized needs into a Product Requirements Doc (PRD), wrote a PRFAQ, set OKRs, and outlined the prototype in Dotted.
Day 2 – Prototype + Internal Test
We created a prototype in Lovable and ran it through internal stakeholder testing. Immediate edits were made based on feedback.
Day 3 – User Test + Edits
A user panel tested the prototype. We analyzed results in UserBrain and iterated quickly to align with staff needs.
Day 4 – Build + Harden
The validated prototype was built in Lovable with Supabase handling backend and security. We ran QA to validate performance.
Day 5 – UAT + Launch
The MVP went through user acceptance testing, then launched into a production environment. We also set OKRs in Tability to track adoption.
Week 2 – Week 4
We retested with a user panel, added post-launch features, tested again, and reviewed OKRs and planned pivots.
Delivered a production-ready MVP in just 5 days, cutting typical development cycles (3–6 months) by more than 80%.
Built a platform that adapts to multiple roles, while adding a Chrome extension to extend usability beyond the app.
In a conservative scenario, Litly achieves a Cumulative annualized ROI (CAGR) of ~74% over 3 years, with a cumulative ROI of 500%+.
Mobile-first, accessibility-compliant workflows made reading tracking easy and engaging for students, while dashboards give students and parents actionable insights.